SUBSCRIBE TO BIG MED AT THE BIG MED SITE ON GOOGLE GROUPS.


November 10, 2009
| AMERICAS | OCEANIA | EUROPE | MIDDLE EAST | ASIA | POLITICS | BUSINESS | RESEARCH | EDUCATION | WORKFORCE |
Big Medicine is published by Team EMS Inc.
Managing Editor
Contact: ideas@tems.ca
Views
Contributor Emeritus
Tools
Stop Violence Against Women & Girls
The views expressed here reflect the views of the authors alone, and do not necessarily reflect the views of any of their organizations. In particular, the views expressed here do not necessarily reflect those of Big Medicine, nor any member of Team EMS Inc.
TOOLS: WEATHER
Hurricane Season 2009
0821 NASA releases GOES-14 satellite video of Hurricane Bill -- NASA
has released a video of Hurricane Bill today from the GOES-14 satellite. The
video was put together from a series of still frames taken by the satellite
using both infrared and visible imagery and provides different views of
Hurricane Bill on August 20.
Earlier this summer, NASA launched the latest Geostationary Operational
Environmental Satellite, GOES-O. Recently operations have been turned over
to the National Oceanic and Atmospheric Administration (NOAA) and the
satellite was renamed GOES-14. The satellite is still being tested in orbit,
and it captured video of Hurricane Bill on August 20, while it was on its
way to Bermuda.
The spectacular video is a collection of a few quick movies put together by
the GOES-14 team from the NASA GOES Project at NASA's Goddard Space Flight
Center in Greenbelt, Md.
 > View video
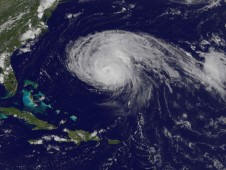
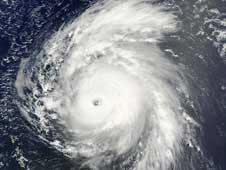
NASA and NOAA's newest weather satellite, GOES-14, has captured some
fascinating views of Hurricane Bill. This is a collection of a few quick
movies put together by the GOES-14 team. Credit: NASAOES Project
The video includes an impressive zoom-out, showing how big the hurricane is,
relative to the hemisphere. Bill is a large hurricane, more than 1,200
kilometers (746 miles) across, and the storm’s partially cloud-filled eye is
nearly 50 kilometers (31 miles) wide.
On August 20, the date of the movie, Hurricane Bill had sustained winds of
135 mph, making it a powerful Category 4 storm. At that time hurricane-force
winds extended outward up to 80 miles from the center. On August 21, Bill's
sustained winds were near 110 mph and hurricane force winds extended up to
115 miles.
0821 NASA watches as Hurricane Bill sweeps over Bermuda -- Hurricane
Bill is raining on Bermuda today, Friday, August 21, and NASA satellites are
providing forecasters with information about Bill's rainfall, clouds and
winds.
NASA and the Japanese Space Agency's Tropical Rainfall Measuring Mission (TRMM)
satellite flew over the center of Hurricane Bill this morning capturing
rainfall data.
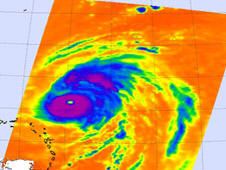
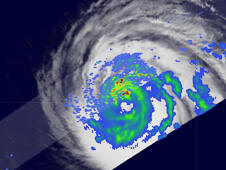
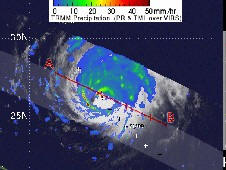 TRMM captured Hurricane Bill's heavy
rainfall on August 21 at 5:22 a.m. EDT. The yellow, green and red areas
indicate rainfall between .78 to 1.57 inches per hour. The red and purple
areas around Bill's eye are considered moderate to heavy rainfall.
Credit: NASA/SSAI, Hal Pierce
TRMM captured Hurricane Bill's heavy
rainfall on August 21 at 5:22 a.m. EDT. The yellow, green and red areas
indicate rainfall between .78 to 1.57 inches per hour. The red and purple
areas around Bill's eye are considered moderate to heavy rainfall.
Credit: NASA/SSAI, Hal Pierce
TRMM rainfall images are false-colored with yellow, green and red areas,
which indicate rainfall between 20 and 40 millimeters (.78 to 1.57 inches)
per hour. TRMM captured Hurricane Bill's heavy rainfall on August 21 at 5:22
a.m. EDT. The yellow, green and red areas indicate rainfall between .78 to
1.57 inches per hour. The red and purple areas around Bill's eye are
considered moderate to heavy rainfall.
According to the National Hurricane Center, Bill is expected to produce
total rain accumulations of 1 to 3 Inches over Bermuda, with maximum amounts
of 5 inches. Both a hurricane and tropical storm watch are in effect for
Bermuda as the rain continues.
For live radar of Bermuda, from the Bermuda Weather Service, visit:
http://www.weather.bm/radarLarge.asp.
The Aqua satellite also flew over Hurricane Bill early today, Friday, August
21, and provided valuable data on his cloud top temperatures. They're
important because they tell forecasters how high thunderstorms are, and the
higher the thunderstorm, the more powerful it is, and Bill is pretty
powerful as a Category Three Hurricane on the Saffir-Simpson Scale.
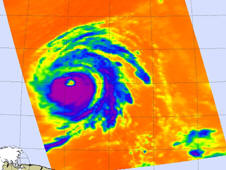
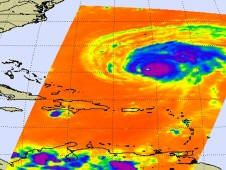 This infrared satellite image from the AIRS
instrument on NASA's Aqua Satellite shows Bill's clouds (depicted in purple
and blue) on August 21 at 2:11 a.m. EDT indicating high, cold powerful
thunderstorms. Credit: NASA JPL, Ed Olsen
This infrared satellite image from the AIRS
instrument on NASA's Aqua Satellite shows Bill's clouds (depicted in purple
and blue) on August 21 at 2:11 a.m. EDT indicating high, cold powerful
thunderstorms. Credit: NASA JPL, Ed Olsen
In infrared imagery, NASA's false-colored purple clouds are as cold as or
colder than 220 Kelvin or minus 63 degrees Fahrenheit (F). The blue colored
clouds are about 240 Kelvin, or minus 27F. The colder the clouds are, the
higher they are, and the more powerful the thunderstorms are that make up
the cyclone.
Although Bill has weakened slightly over the last 24 hours, forecasters say
it could regain a little strength before winds and cooler waters start
battering it and weakening it. Bill is forecast to parallel the eastern U.S.
coast and affect Nova Scotia, Canada, on its curved track into the North
Atlantic Ocean this weekend. As Bill approaches the Canadian Maritimes it
will undergo a transition into an extratropical storm.
At 11 a.m. EDT, Hurricane Bill had maximum sustained winds near 115 mph. He
was moving northwest near 18 mph and is expected to turn to the
north-northwest later today. His center is currently near latitude 27.6
north and longitude 66.3 west or about 335 miles south-southwest of Bermuda
and about 755 miles southeast of Cape Hatteras, North Carolina. Minimum
central pressure is 958 millibars.
Meanwhile a warning is in effect now about large, and dangerous ocean swells
for a huge area in the eastern Atlantic. Large swells associated with Bill
will be impacting the coasts of Puerto Rico; Hispaniola; the Bahamas;
Bermuda the entire eastern United States; and the Canadian Maritimes. The
National Hurricane Center warns "These swells will likely cause extremely
dangerous surf and life-threatening rip currents. Please consult output from
your local weather office for details."
0820 NASA's QuikScat sees Cat 3 Hurricane Bill's winds go a long distance
-- NASA satellites continue to capture important wind speed and cloud data
that forecasters at the National Hurricane Center are using to help their
forecasts. QuikScat has been particularly helpful in determining the extent
of hurricane and tropical storm-force winds, and they go a great distance.
NASA's QuikScat satellite uses microwave technology to peer through the
clouds and measure the surface winds of a tropical cyclone. On Thursday,
August 19, QuikScat data found that Bill's hurricane force winds have
dropped down to a Category 3 hurricane at 125 mph. However, forecasters note
that Bill is moving into an area that could help him strengthen back to
Category 4 hurricane on Friday or Saturday.
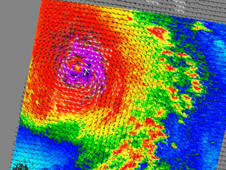 QuikScat used microwaves to peer through
Bill's clouds and measure his winds on August 18 at 5:23 p.m. EDT when Bill
was a powerful Category 4 hurricane. Credit: NASA JPL, Peter Falcon
QuikScat used microwaves to peer through
Bill's clouds and measure his winds on August 18 at 5:23 p.m. EDT when Bill
was a powerful Category 4 hurricane. Credit: NASA JPL, Peter Falcon
Bill's hurricane-force winds extend up to 85 miles from his center, about
the distance from Staten Island, N.Y. to Philadelphia, Penn. Bill's Tropical
storm force winds extend to as far as 230 miles from the center, and that's
about the distance from New York City, N.Y. to Washington, D.C.!
At 5 a.m. EDT on August 19, Bill's maximum sustained winds had decreased to
125 mph, and he was moving northwest near 18 mph. That motion is expected to
continue for a day until he turns to the north-northwest late Friday.
Minimum central pressure was 949 millibars. Bill was located about 790 miles
south-southeast of Bermuda and only 325 miles north-northeast of the Leeward
Islands.
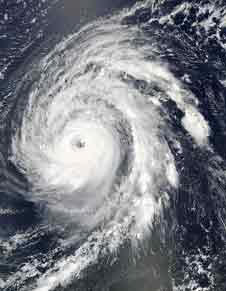
NASA's Terra satellite also flew over Bill, and using the Moderate Imaging
Spectroradiometer (MODIS) instrument captured an image of the storm when it
was located off the Lesser Antilles in the Atlantic Ocean on August 19 at
12:15 p.m. EDT. MODIS showed a strong hurricane with a well-defined eye.
 NASA's MODIS instrument on the Terra
satellite captured Hurricane Bill, located off the Lesser Antilles in the
Atlantic Ocean on August 19 at 12:15 p.m. EDT. Credit: NASA, MODIS
Rapid Response
NASA's MODIS instrument on the Terra
satellite captured Hurricane Bill, located off the Lesser Antilles in the
Atlantic Ocean on August 19 at 12:15 p.m. EDT. Credit: NASA, MODIS
Rapid Response
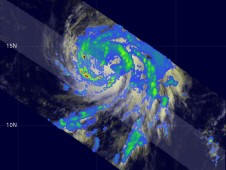
NASA's Aqua satellite joined QuikScat and Terra to capture Hurricane Bill. Aqua's Atmospheric Infrared Sounder (AIRS) instrument captured Bill's frigid cloud temperatures on August 20 at 1:29 a.m. EDT. The imagery clearly showed Bill's 30- mile wide eye in the center of the storm, and indicated Bill's high thunderstorm cloud temperatures were colder than minus 63 Fahrenheit.
 NASA's AIRS instrument on the Aqua
satellite caught Bill's icy cold clouds on August 20 at 1:29 a.m. EDT as it
was moving toward the Leeward Islands (left of the storm). Notice Bill's 30
mile wide eye is well-defined in the center of the storm. In this
false-colored image, purple indicates Bill's high thunderstorm cloud
temperatures are colder than minus 63F and blue is minus 27F or colder.
Credit: NASA JPL, Ed Olsen
NASA's AIRS instrument on the Aqua
satellite caught Bill's icy cold clouds on August 20 at 1:29 a.m. EDT as it
was moving toward the Leeward Islands (left of the storm). Notice Bill's 30
mile wide eye is well-defined in the center of the storm. In this
false-colored image, purple indicates Bill's high thunderstorm cloud
temperatures are colder than minus 63F and blue is minus 27F or colder.
Credit: NASA JPL, Ed Olsen
Hurricane Bill is hundreds of miles away from the U.S. coast today, but
forecasters are cautioning about large swells the storm is creating already.
The National Hurricane Center noted that "Large swells associated with bill
will be impacting the islands of the northeast Caribbean Sea, the Bahamas
and Bermuda during the next day or two." Meanwhile, residents along the east
coast of the U.S. should be on watch, starting Friday and over the weekend,
as large swells will begin to affect areas of the coast. Rip tides may also
be possible, so beachgoers and boaters should be aware of the hazardous
conditions Bill will create along the coasts this weekend.
The National Hurricane Center in Miami, Fla. is forecasting Bill to pass to
the west of Bermuda and then track parallel to the U.S. east coast over the
weekend, stirring up the ocean.
0819 NASA's Aqua Satellite gets two views of Category Four Hurricane Bill
-- Hurricane Bill has become a powerhouse in the Atlantic Ocean and NASA
satellites are providing forecasters with important information to help
their forecasts. Bill is now a category four hurricane on the Saffir-Simpson
Scale and is expected to strengthen as it nears Bermuda, and NASA's Aqua
satellite captured two views of his cloud cover.
On Wednesday, August 19, at 5 a.m. EDT, Bill's maximum sustained winds are
near 135 mph, and hurricane force-winds extend out to 45 miles from Bill's
large 35-45 mile-wide eye. Bill was closing in on the Leeward Islands, about
460 miles east of them, near 18.0 degrees north latitude and 54.9 west
longitude. Bill continued to move west-northwest at 16 mph and had a minimum
central pressure near 948 millibars.
 AIRS
captured Hurricane Bill's cold clouds with infrared imagery on August 18 at
12:35 p.m. EDT. The infrared revealed very cold high clouds, indicating a
powerful hurricane. Credit: NASA JPL, Ed Olsen
AIRS
captured Hurricane Bill's cold clouds with infrared imagery on August 18 at
12:35 p.m. EDT. The infrared revealed very cold high clouds, indicating a
powerful hurricane. Credit: NASA JPL, Ed Olsen
NASA's Atmospheric Infrared Sounder (AIRS) instrument on the Aqua satellite
captured Hurricane Bill's cold clouds with infrared imagery on August 18 at
12:35 p.m. EDT. The infrared revealed very cold high clouds, indicating
strong thunderstorms and a powerful hurricane. Infrared imagery is useful to
forecasters because it shows the temperature of the cloud tops, helping
recognize if powerful thunderstorms exist in the storm. AIRS infrared
imagery showed Bill's thunderstorm clouds are cold as or colder than 220
Kelvin or minus 63 degrees Fahrenheit (F)!
Meanwhile, the Moderate Imaging Spectroradiometer, or MODIS instrument on Aqua satellite captured a stunning image of Hurricane Bill on August 18 at 2:40 p.m. EDT, clearly showing his large eye.
 The
MODIS instrument on NASA's Aqua satellite captured this stunning image of
Hurricane Bill on August 18 at 2:40 p.m. EDT. Credit: NASA MODIS Rapid
Response Team
The
MODIS instrument on NASA's Aqua satellite captured this stunning image of
Hurricane Bill on August 18 at 2:40 p.m. EDT. Credit: NASA MODIS Rapid
Response Team
Bill's track has been the question on the minds of U.S. East Coast
residents, and currently the models are indicating two different scenarios.
According to the National Hurricane Center discussion this morning, August
19, "The track guidance models forecast Bill to gradually turn northwestward
towards this weakness during the next 48-72 hours."
There's a large "deep-layer trough" – an elongated area of low pressure,
associated with a cold front that is moving into the eastern United States,
and forecasters think that front is going to push Bill eastward and curve
him north and northeastward. Bill's track depends on the strength of the
front and the timing, so one model calls for Bill to go near New England
while other computer models have him taking a sharp turn out to sea.
Forecasters and East Coast residents are hoping the front pushes Bill out to
sea.
20090819 NASA's TRMM satellite sees wide-eyed Hurricane Bill strengthening--The TRMM satellite noticed a wide-eyed Hurricane Bill's rainfall is intensifying indicating he's getting stronger. Satellite images have also shown Bill's eye is widening.
TRMM captured Hurricane Bill's heavy
rainfall on August 17 at 10:25 p.m. EDT. The yellow, green and red areas
indicate rainfall between .78 to 1.57 inches per hour. Red areas are
considered moderate rainfall. Credit: NASA, Hal Pierce
NASA and the Japanese Space Agency's Tropical Rainfall Measuring Mission (TRMM)
satellite flew over the center of Hurricane Bill on August 18, 2009 at 0225
UTC (August 17 at 10:25 p.m. EDT) capturing rainfall data.
TRMM rainfall images are false-colored with yellow, green and red areas,
which indicate rainfall between 20 and 40 millimeters (.78 to 1.57 inches)
per hour. Red areas are considered moderate rainfall.
The TRMM rainfall analysis from the TRMM Microwave Imager (TMI) and
Precipitation Radar (PR) instruments reveal that hurricane Bill has an eye.
This feature isn't apparent on the TRMM Infrared image (VIRS) but is
evidence of Bill becoming a stronger category two hurricane with wind speeds
increasing to about 85 knots (~98 miles per hour). In fact, satellite
imagery shows that Bill's eye is quite large, between 35-45 nautical miles
in diameter!
At 11 a.m. EDT, Hurricane Bill had maximum sustained winds near 105 mph,
making him a Category Two on the Saffir-Simpson Scale. He is expected to
strengthen into a Category Three hurricane, a major hurricane, with winds in
excess of 110 mph. Bill was centered about 705 miles east of the Leeward
Islands, near 15.9 north and 51.2 west. He was heading west-northwest near
16 mph with a minimum central pressure of 963 millibars.
Interests in the Leeward Islands should monitor Bill's progress, as his
track is currently expected to remain at sea and sweep past them and head in
a northwesterly direction over the next two days.
20090818 Two NASA satellites capture Hurricane Bill's 'baby pictures'--Bill was the third tropical depression in the Atlantic Ocean hurricane season, behind Ana and Tropical Depression One. Over the weekend Bill grew into the first hurricane in the Atlantic this season. Two NASA Satellites captured Bill's rainfall and cloud temperatures as he was powering up.
The TRMM satellite flew over the large and
well-organized Hurricane Bill at 7:33 a.m. EDT on August 17 indicating bands
of heavy rainfall. Credit: NASA, Hal Pierce
Hurricane Bill was upgraded to a hurricane by the National Hurricane Center
(NHC) in Miami, Florida on August 17 at 5 a.m. EDT. The Tropical Rainfall
Measuring Mission (TRMM) satellite flew over hurricane Bill a short time
later at 1133 UTC (7:33 a.m. EDT) and captured Bill's "baby picture" shortly
after he became a hurricane.
Data from the TRMM over flight was used in making the rainfall analysis at
NASA's Goddard Space Flight Center in Greenbelt Md. The rainfall analysis
showed that Bill was already a large and well- organized hurricane. TRMM's
Microwave Imager and Precipitation Radar instruments revealed that Bill has
bands of heavy rainfall.
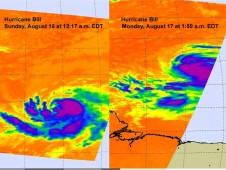
This is a time series of two AIRS images of
Hurricane Bill on August 16 at 12:17 a.m. EDT (left) and August 17 at 1:50
a.m. EDT (right) showing the cold temperatures in his thunderstorms,
indicative of heavy rainfall. Credit: NASA/JPL, Ed Olsen
NASA's Aqua satellite captured Hurricane Bill on August 16 at 12:17 a.m. EDT
and August 17 at 1:50 a.m. with the Atmospheric Infrared Sounder (AIRS)
instrument. AIRS measures cloud temperature using infrared light. In NASA's
infrared imagery, the false-colored purple clouds are as cold as or colder
than 220 Kelvin or minus 63 degrees Fahrenheit (F). The blue colored clouds
are about 240 Kelvin, or minus 27F. The colder the clouds are, the higher
they are, and the more powerful the thunderstorms are that make up the
cyclone and Bill has some high thunderstorms.
On Monday, August 17 at 11 a.m. EDT, Bill continued strengthening and is
expected to become a major hurricane - that is a Category Three hurricane,
by Wednesday. Today, however, Bill had sustained winds near 90 mph, and the
hurricane force winds extended 30 miles out from the center. Bill was moving
west-northwest near 16 mph and had a minimum central pressure near 977
millibars. Bill was centered about 1,080 miles east of the Lesser Antilles,
near 14.1 north and 45.2 west.
Bill is predicted by the NHC to become a dangerous category three storm in
the next three days with winds of 110 knots (~126.5 miles per hour).
20090818 Tropical Storm Claudette makes landfall in Florida--By
mid-day today, Monday, August 17, Claudette's center had moved into
southwestern Alabama and weakened into a tropical depression. She'll turn
toward the north-northwest later today and soak Alabama with up to 10 inches
of rain in some isolated areas.
At 2 a.m. EDT on Monday, August 17, Tropical Storm Claudette made landfall
near Fort Walton Beach, Florida with maximum sustained winds near 50 mph.
When it made landfall, tropical storm force winds extended 70 miles from the
center, so towns from 70 miles to the east and west of Claudette's center
received sustained winds over 37 mph.
The National Hurricane Center in Miami, Florida issued their last advisory
on Claudette this morning at 7 a.m. EDT. Now, NOAA's Hydrometeorological
Prediction Center (HPC) is issuing forecasts on Claudette as she moves
through the interior U.S. At 10 a.m. EDT today, the HPC said that Claudette
will track north-northwest through southwestern Alabama and northern
Mississippi tonight.
The HPC expects "More precipitation to break out during the day across
Alabama and the Florida panhandle mainly east of the circulation center."
They "suspect that tonight there will be the potential for very heavy
rainfall amounts near the center as it reaches into northern Mississippi,
especially in overnight hours when convection often flares near the center
of circulation. Still expect the potential for 3 to 6 inch totals with
Claudette...and isolated totals up to 10 inches mainly within the stationary
bands of rainfall across the Florida panhandle."
At 8 a.m. EDT the center of tropical depression Claudette was located near
latitude 31.3 north and longitude 87.2 about, 15 Miles North-Northwest of
Brewton, Alabama and about 85 miles southwest of Montgomery, Alabama. She
was moving northwest near 12 mph. Claudette's sustained winds were down to
35 mph, and she'll continue to weaken today as she moves farther inland. The
estimated minimum central pressure is 1011 millibars.
The National Weather Service in Tallahassee reported that the cities of
Apalachicola and St. George areas saw a combined 4-6 inches of rain since
Sunday morning. The highest wind gust in Apalachicola was reported at 50
mph.
NASA's Aqua satellite captured Tropical Storm Claudette on Sunday, August 16
at 2:30 p.m. EDT (1:30 p.m. CDT) about 12 hours before her eye made landfall
near Fort Walton Beach, Florida. The image was captured by the Moderate
Imaging Spectroradiometer (MODIS) instrument. The Atmospheric Infrared
Sounder (AIRS) instrument that measures cloud temperature using infrared
light. The higher the clouds are, the colder they are. One interesting thing
that AIRS showed forecasters was that the extent of the cloud cover almost
doubled in 11 hours on Sunday, August 16 between 3:29 a.m. EDT and 2:29 p.m.
EDT, when AIRS captured images of Claudette.
Now, residents of Alabama and Mississippi should expect heavy downpours and
localized flooding from Claudette's rains. The system is expected to move
toward the northwest and by tomorrow it is expected to have weakened to a
depression over western Tennessee.
20090818 Tropical Depression Ana drenching Puerto Rico--Tropical
Depression Ana is currently drenching Puerto Rico, and tropical storm
watches are posted for Puerto Rico and the Virgin Islands as Ana continues
westward. Both the Aqua and GOES satellites have captured Ana on her
westward track in the Atlantic.
For a live look at the National Weather Service Radar in Puerto Rico
Tropical Depression Ana has taken a long time to get going and she's still squeaking by as a tropical depression. Over the weekend, NASA satellite imagery captured her short stint as a tropical storm, but she's weakened again and is expected to now rain on Hispaniola before heading to Florida.
By 11 a.m. EDT on Monday, August 17, Ana's center was located 75 miles south of San Juan, Puerto Rico, near 17.3 north and 66.2 west. She was moving at a good clip toward the west-northwest near 28 mph, which means that she won't linger as long and dump as much rain. However, she's expected to slow down in the next day or two. Maximum sustained winds remain near 35 mph, and minimum central pressure is 1008 millibars.
The Atmospheric Infrared Sounder (AIRS) flies on Aqua and provides visible, infrared and microwave images and measures cloud top temperature and pressure. AIRS captured an image of Ana on August 15 when she was a tropical storm and had good cloud formation. By mid-day on August 16, Ana deteriorated into a tropical depression.
How does infrared imagery know how high clouds are in the sky? The coldest ones are higher in the sky (because in the troposphere, the lowest layer of atmosphere where weather happens, temperatures fall the higher up you go until you get to the stratosphere). The highest clouds are as cold as or colder than 220 Kelvin or minus 63 degrees Fahrenheit (F) and second highest level of clouds are about 240 Kelvin, or minus 27F. The colder the clouds are, the higher they are, and the more powerful the thunderstorms are that make up the cyclone.
Another satellite that NASA uses is the Geostationary Operational Environmental Satellite, or GOES. GOES-12 covers the Atlantic Ocean, and is managed by NOAA. On August 17 at 12:15 p.m. EDT, GOES-12 captured Tropical Depression Claudette over Alabama, and Tropical Depression Ana raining on Puerto Rico.
Forecasters are closely watching Ana because she may degenerate further. However, her remnants or the depression, whichever she becomes, is expected to track to Florida's west coast.
Caribbean: PAHO releases new wind hazard maps
[May 28 Washington DC]--The Pan American Health Organization (PAHO) Emergency Preparedness and Disaster Relief Coordination unit, through Applied Research Associates, has developed new state-of-the-art wind hazard maps for Caribbean islands and nearby coastal areas of Central and South America. The maps use the most up-to-date meteorological records and methods and are intended to replace older maps currently in use for structural design and risk assessment. They are an important aid for engineers, developers, and others whose work requires knowledge of wind hazards.The new maps, created by PAHO’s Emergency Preparedness and Disaster Relief Coordination unit through Applied Research Associates, benefit from more than 20 years' worth of new data collected since the last Caribbean regional wind hazard map for engineering design purposes was developed in 1985. Moreover, they are based on the latest developments in hurricane forecasting and tracking and estimation of wind speed and direction, which are recognized by consensus in the scientific community.
Reliable wind hazard information is crucial for the work of engineers whose projects must resist hurricane-force winds, for building developers or owners who wish to specify the level of safety of their facilities, and for insurance providers who wish to know the risks they underwrite. Financial institutions also sometimes wish to specify wind design criteria for their projects.
Currently, regional building standards for wind resistance are laid out in the 1985 Caribbean Uniform Building Code (CUBiC). The higher-than-normal hurricane activity in the North Atlantic over the past 13 years has led to the questioning of wind design criteria incorporated in the present standards in the Caribbean. A project funded by the Caribbean Development Bank (CDB) and executed by the Caribbean Regional Organization for Standards and Quality (CROSQ) is currently developing new regional standards to replace the CUBiC. However, this project does not include new wind hazard maps for the region. The new PAHO Caribbean Basin Wind Hazard Maps are consistent with the CDB-CROSQ process in that both are based on U.S.A. "International" codes that reference the wind load provisions of the American Society of Civil Engineers.
The new Caribbean Wind Hazard Maps were developed in consultation with regional meteorologists, officials and experts from PAHO member countries, regional engineers and architects. This open consultation process, coordinated by Caribbean engineer Tony Gibbs, was followed to facilitate the adoption of the maps by Caribbean communities. Funding for the project was provided by the Office of Foreign Disaster Assistance of the U.S. Agency for International Development (OFDA/USAID).
Why were new wind hazard maps prepared?
1. The present project includes the Caribbean coastlines of South and
Central American countries. In several of these cases there is no presently
available wind hazard guidance for structural design purposes. The new maps
will plug that gap.
2. The only pan-Caribbean wind hazard maps ever produced for application in the design of structures were in 1969 (Caribbean Meteorological Institute – H C Shellard), 1981 (Caribbean Meteorological Institute – B Rocheford), 1985 (University of Western Ontario Boundary Layer Wind Tunnel Laboratory – Davenport, Surry, Georgiou).
3. Since 1985 the region has collected another 23 years of relatively reliable data. The incorporation of these data would serve to improve the quality of currently-available wind hazard information.
4. There have been developments in the science and technology related to the long-term forecasting of hurricane activity in the North Atlantic (including the Caribbean).
5. The past 13 years of higher-than-normal hurricane activity in the North Atlantic has led to the questioning of wind design criteria incorporated in the present standards in the Caribbean.
6. This, in turn, has led to uninformed and unreasonable and counterproductive decisions on appropriate basic (and therefore design) wind speeds for some Caribbean projects and in some Caribbean countries.
7. The phenomenon of hurricane activity in the Caribbean is best dealt
with regionally and not in a country-by-country manner.
What use will be made of the results of the proposed project?
1. New regional standards are currently being prepared in a project funded
by the Caribbean Development Bank (CDB) and executed by the Caribbean
Regional Organisation for Standards and Quality (CROSQ). These will replace
the Caribbean Uniform Building Code (CUBiC). The CDB-CROSQ project does not
include new wind hazard maps for the target region. These new Caribbean
Basin maps have been prepared to be consistent with the CDB-CROSQ intension
to base the new standards project on the USA “International” codes which
reference the wind load provisions of the American Society of Civil
Engineers (ASCE 7 Chapters 2 and 6). Thus the results of this wind hazard
mapping project could be plugged directly into the new CDB-CROSQ standards.
2. Those Caribbean countries which, for whatever reason, are developing their own standards and not participating in the CDB-CROSQ project will also require wind hazard information. This wind hazard mapping project will provide wind hazard information which could readily be represented in forms designed to fit directly into standards documents with different approaches. (Technical standards in the Caribbean are best dealt with regionally and not in a country-by-country manner. This comment relates particularly to the Commonwealth Caribbean.)
3. Engineers in all Caribbean countries are designing projects every day
which must resist the wind. Confidence in the wind hazard information is
important to designers. Clients sometimes wish to specify the levels of
safety of their facilities. Insurance providers sometimes wish to know the
risks they underwrite. This depends critically on the quality of hazard
information. Financing institutions sometimes wish to specify wind design
criteria for their projects. There is, in summary, an immediate and palpable
need for wind hazard information based on up-to-date meteorological records
and methodologies recognised by consensus in the scientific community.
The open process adopted in his project is exemplified by:
1. The present Caribbean Basin Wind Hazard Maps (CBWHM) project has prepared a series of overall, regional, wind-hazard maps using uniform, state-of-the-art approaches covering all of the Caribbean islands and the Caribbean coastal areas of South and Central America. The project was executed in consultation with interest groups throughout the target region.
2. An interim, information meeting was held at PAHO in Barbados on 01 October 2007. Meteorologists, engineers, architects, emergency managers, standards personnel and funding agency personnel from the wider Caribbean were invited (and were funded) to attend.
3. At that meeting the principal researcher, Dr Peter Vickery of Applied
Research Associates (ARA) described the methodology for developing the maps;
presented the interim results available at the time of the meeting; received
comments from participants and answered their questions; discussed what
systems need to be put in place to improve knowledge of the wind hazard in
the Caribbean region and outlined the further work to finalise the present
mapping exercise.
Online:
Urban weather: Cities incite thunderstorms
[Aug 10 Princeton NJ USA]--Summer thunderstorms become much more fierce when they collide with a city than they would otherwise be in the open countryside, according to research led by Princeton engineers.Alexandros A. Ntelekos and James A. Smith of Princeton University’s School of Engineering and Applied Science based their conclusion on computer models and detailed observations of an extreme thunderstorm that hit Baltimore in July of 2004.
Their modeling suggests that the city of Baltimore experienced about 30 percent more rainfall than the region it occupies would have experienced had there been no buildings where the city now sits.
 This
picture shows the pattern of lightning strikes near
Baltimore and Washington, D.C. during the rare and extreme
2004 thunderstorm.
This
picture shows the pattern of lightning strikes near
Baltimore and Washington, D.C. during the rare and extreme
2004 thunderstorm.
While thunderstorms are thought of as being purely forces of
nature, the Princeton research suggests that man’s built
environment can radically alter a storm’s life cycle.
A storm of the intensity of the 2004 event in Baltimore is
extremely rare, occurring only once every 200 years or so.
However, climate change is expected to make such events more
frequent, according to the fourth assessment report of the
Intergovernmental Panel on Climate Change (IPCC).
“Precipitation events like gully-washing rainstorms are
expected to increase in intensity as the world warms due to
the buildup of greenhouse gases,” said Michael Oppenheimer,
a lead author on the IPCC report and the Albert G. Milbank
Professor of Geosciences and International Affairs at
Princeton. “This is just the sort of research that combines
science, engineering, and social response that may allow us
to better cope with the future, warmer climate. I hope it
will also serve as a warning about the complexity of
adaptation, and therefore, as a goad to policymakers to act
more urgently to stabilize the climate.”
In yesterday’s intense storm in New York City -- which
played havoc with subways, street traffic, and airports –
about three inches of rain fell in one hour. In the 2004
storm that the researchers studied, about six inches fell
within two hours.
“The storm that occurred yesterday in New York City is an
example of the sort of event that we expect more of in the
future,” said Oppenheimer. “The disruptive effect was quite
obvious.”
Observational data shows that, during the 2004 storm, parts
of Baltimore experienced as many lightning strikes in the
space of two hours as they normally receive during the
course of a year.
Much of the lightning during the 2004 storm wrapped around
the western edges of Baltimore and Washington, D.C., to the
south. “It’s as if all of a sudden the lightning can ‘feel’
the city,” said Ntelekos, a Princeton graduate student in
civil and environmental engineering who is a fellow with the
Woodrow Wilson School’s Science, Technology, and
Environmental Policy (STEP) program.
The interaction between storm and city has serious
consequences for urbanites as well as policymakers.
“This means that warm-season thunderstorm systems will
probably increasingly lead to more flash flooding, which can
be very dangerous,” said Smith, a professor of civil and
environmental engineering at Princeton.
Hydrologists have observed evidence in the past that urban
environments alter the behavior of storms. But they have
mostly noted average increases in rainfall over long periods
of time. Until now, they have not made observations of
specific extreme storms because they lacked the right tools
to do so.
The National Science Foundation-funded research by Ntelekos
and Smith pieced together many different pieces of
observational information on lightning strikes, rainfall,
clouds and aerosols -- which they combined with analyses
based on computer models of the atmosphere.

The combined data yielded surprising conclusions. For
example, neighboring cities also can affect the behavior of
a storm. The Ntelekos-Smith research showed that the 2004
storm over Baltimore was partially affected by the
neighboring urban environment of Washington D.C. as air from
the south became more turbulent when passing over it. This
made the air mass particularly ripe for a storm by the time
it reached Baltimore.
The scientific consensus so far has been that, during a
storm, greater rainfall occurs on the downwind part of the
city than on the upwind side.
However, the researchers found that during the 2004
Baltimore storm, the western part of the city -- not the
upwind, northern part -- was hit harder by rainfall and thus
extreme flooding, according to Ntelekos.
“Previous studies basically came from cities where the
terrain was simple, where you had a town in the middle of
nothing -- no mountains, no water,” he said. “But most of
the hub cities are close to either mountains or water as
well as being close to other cities. So we have to
understand how extreme thunderstorms behave over complex
terrains.”
Ntelekos and Smith are presenting some of their research
this week at a workshop sponsored by MIRTHE, a National
Science Foundation Engineering Research Center at Princeton
University.
Exactly how does the urban environment alter the evolution
of thunderstorms" The researchers described three
mechanisms:
Urban heat islands: Cities produce heat and are often 2 to 5
degrees Fahrenheit hotter than the surrounding environment.
In milder storms, this “heat island” can provide fuel for a
modest thunderstorm. But in their study of the 2004
thunderstorm, the Ntelekos and Smith found that the heat
island had little effect because high winds leveled
temperatures.
Urban canopies: While forests have tree canopies, cities
have building canopies. The height and placement of
buildings alters a storm’s low-level wind field, a key
ingredient in its behavior. The tall buildings increase wind
drag on the city, resulting in vertical velocities –
essentially a boiling action – that can enhance rainfall.
The urban canopy had a large effect during the 2004 storm,
the researchers found, which was exacerbated all the more by
the presence of the Chesapeake Bay to the east.
Urban aerosols. These are essentially minuscule particles in
the atmosphere that are at elevated levels in urban
environments due to industrial and automobile emissions.
Traditionally, researchers have thought that air pollution
tends to suppress precipitation. But Ntelekos and Smith
believe their research points to the possibility that urban
aerosols actually increase rainfall.
Ntelekos plans to build on his Baltimore research in a more
detailed study of the effect of aerosols on thunderstorms in
New York City. That research will be a testbed for
laser-based sensor technologies being developed by
Princeton’s MIRTHE center, which is charged with developing
next-generation sensor technology for the environmental
monitoring, medical diagnostics and national security.
Ntelekos and Smith have written a paper that describes the
findings of the 2004 storm over Baltimore and which is
currently under review by the Water Resources Research
journal published by the American Geophysical Union. Their
coauthors on this paper are Krajewski and Radoslaw Goska of
the University of Iowa; Mary Lynn Baeck of Princeton; and
Andrew J. Miller of the University of Maryland, Baltimore
County. Ntelekos and Smith are also coauthors with Witold F.
Krajewski, Chair of Water Resources Engineering at the
University of Iowa, of a recent paper in the Journal of
Hydrometeorology which describes links between summer
thunderstorms and flash flooding in the Baltimore
metropolitan region.
PAPER ABSTRACT: The climatology of thunderstorms and flash
floods in the Baltimore, Maryland, metropolitan region is
examined through analyses of cloud-to-ground (CG) lightning
observations from the National Lightning Detection Network (NLDN)
and discharge observations from 11 U.S. Geological Survey (USGS)
stream gauging stations. A point process framework is used
for analyses of CG lightning strikes and the occurrences of
flash floods. Analyses of lightning strikes as a space–time
point process focus on the mean intensity function, from
which the seasonal, diurnal, and spatial variation in mean
lightning frequency are examined. Important elements of the
spatial variation of mean lightning frequency are 1)
initiation of thunderstorms along the Blue Ridge, 2) large
variability of lightning frequency around the urban cores of
Baltimore and Washington D.C., and 3) decreased lightning
frequency over the Chesapeake Bay and Atlantic Ocean.
Lightning frequency has a sharp seasonal maximum around
mid-July, and the diurnal cycle of lightning frequency peaks
between 2100 and 2200 UTC with a frequency that is more than
an order of magnitude larger than the minimum frequency at
1200 UTC. The seasonal and diurnal variation of flash flood
occurrence in urban streams of Baltimore mimics the seasonal
and diurnal variation of lightning. The peak of the diurnal
frequency of flash floods in Moores Run, a 9.1-km2 urban
watershed in Baltimore City, occurs at 2200 UTC. Analyses of
the lightning and flood peak data also show a close link
between the occurrence of major thunderstorms systems and
flash flooding on a regional scale.
FULL CITATION: Ntelekos, A.A., J.A. Smith and W.F. Krajewski,
Climatological Analyses of Thunderstorms and Flash Floods in
the Baltimore Metropolitan Region, Journal of
Hydrometeorology, 8(1), 88-101, 2007.
NOAA news conference on the 2007 Atlantic hurricane season
outlook
[May 23 07 Arlington VA USA]--Mr. Franklin: Good morning.
Welcome to the 2007 Atlantic hurricane season outlook. My
name is Anson Franklin, Director of Communications with NOAA.
We have several speakers here today to talk about the
hurricane outlook.
We have information about the sequence of appearance in your
press kits. And as soon as they finish speaking, we will
have about – we will have a few minutes to take questions
from you. And at that point, I’ll just point out the
questioner, then we’ll take it from there.
Starting off is the Administrator of NOAA, Admiral Conrad
Lautenbacher.
Admiral Lautenbacher: Thank you, Anson. Good morning, ladies
and gentlemen, and thank you all for coming today. This is,
I think, as everybody realizes, the first event of National
Hurricane Awareness Week. This is our Atlantic seasonal
outlook, and one of our most highly anticipated
announcements – and for good reason. As I think most people
know, our coasts are becoming more populated. There are 153
million people living in our coastal areas in the United
States. Fifty-three percent of our population lives in
coastal areas, and a good number of those Americans live in
hurricane-prone areas.
Now, what we’ve found is that the growth continues in these
areas. If you look at Florida, for instance, from 1950
through the year 2000, there has been a 500 percent growth
in population. Coastal areas continue to be more and more
popular for people to move.
We are right now in what we call a period of more active
hurricane seasons. An active season increases the
possibility of land-falling hurricanes, but before I give
you the numbers, let me be sure that – it just takes one
hurricane to make it a bad year for everyone here. So if
there’s one or 21, we are here today to ensure that the
American public and all those that are concerned with
hurricane management and recovery take into account the
potential for this season and are prepared.
Now, the outlook for this year, as I mentioned, we’re in
above-normal Atlantic hurricane seasonal period. We are
forecasting 13 to 17 named storms, of which seven to 10 will
become hurricanes, and three to five of those hurricanes
will be in the major category, or category 3 strength and
higher.
I want to mention that the ability to be able to do these
forecasts, as well as the forecasts during the season, have
been the results of hours – thousands of hours of work by
our scientists and by scientists in academia, public and
private, to work on an extraordinary partnership in building
the data, the information, the models, and the connectivity
to provide this information.
Everybody should realize that because of the support of the
Administration and Congress, we have within NOAA over $300
million dedicated to hurricane operations and research this
year. And since 2005, we have added $40 million more in
additional resources for hurricane research and operations.
And in this year’s budget, there’s another $10 million
requested in 2008, the budget which is in Congress at this
point. And we want to point out that this investment is well
placed, because it results in an average annual savings to
the country of $3 billion.
One of the special-interest items that we’ve been able to
install in our operations center this year is something
called the HWRF, the Hurricane Weather Research and Forecast
model. We have been working hard on building our – improving
our ability to forecast intensity. This is the latest
state-of-the-art model. It’s a Coupled Ocean-Atmosphere
Model. It is designed to take into account for the first
time airborne Doppler radar data, which will analyze initial
storm intensity and structures. It also makes use of a wide
variety of observations from our satellites, data buoys, and
the aircraft that you see like the one behind me. And there
are two more behind these hangar doors, which I hope that
you will take a look at at the conclusion of this
conference.
But it takes defense in-depth like this to produce the kinds
of forecasts that we’re talking about. And I would like to
just mention that behind me is NOAA’s G4 high-altitude jet.
This was the latest or most recent addition in modernization
to our air fleet. It’s a high-altitude jet that determines
the steering currents and looks at the structure of the
storm and allows us to initialize and look at the steering
currents for the track of the storm.
Now, behind the hangar doors, we have the WP3D, which is the
workhorse of our fleet that goes into the storm and actually
flies through the eye of the storm. It’s a hurricane hunter
designed for research. And right behind that, we have the
C-130J, which actually does the work for tracking hurricanes
during the season. This is managed and run by the U.S. Air
Force. This is the 53rd Weather Reconnaissance Squadron,
which does the routine daily tasking throughout the entire
season for us, and is a partner that we could not do
without.
And I want to close by mentioning that without our partners,
we wouldn’t be here today. We see them on the stage here in
terms of FEMA and the Air Force that are represented here
today. We’re delighted to have Secretary Chertoff with us,
David Paulison, the FEMA administrator, Lieutenant General
John Bradley, the head of the United States Air Force
Reserve and very important partner.
Let me close by again saying that this day is about
preparedness. It’s about getting the word out to the
American public that hurricanes are dangerous, they can be
destructive, they can be lethal. It’s our job to give you
warnings in order that you can be prepared. We hope that
everybody will have a safe hurricane season for this year.
Now I’d like to introduce to you Dr. Gerry Bell, our
Seasonal Hurricane Climate Prediction Center Lead Forecaster
who will give you a little bit more on the science behind
the numbers which I just provided.
Dr. Bell.
Dr. Bell: Well, thank you, Admiral. Well, as the Admiral
mentioned, we’re in an active hurricane era that started in
1995. And while we can’t say for sure how long this era will
last, historically other active eras have lasted 25 to 40
years. So we’re now 12 years into an active hurricane era
that could last a total of 25 to 40 years historically.
For 2007, we’re predicting a high probability of an
above-normal Atlantic hurricane season. And just to
reiterate, we’re looking at 13 to 17 named storms, seven to
10 hurricanes, and three to five major hurricanes.
As with other active seasons, active seasons just aren’t
about the numbers, but it’s about where these hurricanes
form. During active seasons, you have a lot of hurricanes
forming in the deep tropics, and it’s called the main
hurricane development region. And many of these storms are
expected to form during August, September and October.
Unfortunately, these are the systems that generally track
westward toward the Caribbean Sea and the United States as
they strengthen, and therefore, they pose an increased
threat to the United States.
Now, although NOAA doesn’t make an official hurricane
landfall forecast, seasons with similar levels of activity
have historically had two to four land-falling U.S.
hurricanes, and, generally, two to three hurricanes in the
region around the Caribbean Sea.
However, it’s important to note that it’s currently not
possible to confidently predict at this time, at these
extended ranges, really, the exact number or intensity of
land-falling hurricanes, or whether a given locality will be
impacted this season.
Because of the extensive research done by the NOAA, the
National Weather Service, and their supporting institutions,
the main climate patterns controlling Atlantic hurricane
activity are now better understood than ever before.
There are two main climate patterns that we expect to be
responsible for the above-normal season this year. The first
is the ongoing conditions that we’ve seen since 1995, and we
call these conditions the multidecadal signal. The second is
the possible development of a La Niña episode in the
tropical Pacific Ocean.
The conditions regarding the multidecadal signal, the
conditions expected this year, again, are very similar to
what we’ve seen since 1995, and that’s when the current
active era began. Since 1995, nine of the last 12 seasons
have been above normal. And of course, we all know the rate
of hurricane landfalls has increased sharply.
NOAA’s extensive research shows that this increased
hurricane activity is related to tropical rainfall, and
Atlantic Ocean temperature patterns that, as I mentioned,
historically tend to last 25 to 40 years at a time.
This multidecadal signal is very important, because it
produces and accounts for the entire set of conditions that
are known to produce active hurricane eras.
The second major predictor for this season is the strong
likelihood of either ENSO-neutral or La Niña conditions
during August to October, which of course is the peak of the
season. NOAA’s Climate Prediction Center at this time is
currently indicating La Niña could develop within the next
one to three months. Unfortunately, the combination of La
Niña and an active hurricane era is known to produce very
active hurricane seasons.
Now, even if La Niña doesn’t develop, the conditions
associated with this ongoing active hurricane era still
favor an above-normal season. And as we’ve seen since 1995,
several seasons have been very active, even in the absence
of La Niña.
Looking back for a moment at least year, we over-predicted
the 2006 Atlantic hurricane season, and that was mainly
because of a rapidly developing El Niño during August and
September that subsequently shut the activity down. This
year, we’re not in that situation. Instead, we’re looking at
opposite conditions where we may be transitioning into a La
Niña.
Very importantly, regarding last year, detailed published
analysis by NOAA shows that all of the conditions associated
with the current active era were still in place last year as
we had expected. Therefore, last year’s activity should not
be considered an indicator that this active era has ended.
There is no indication that this active hurricane era has
ended.
This ongoing active hurricane era means that the 2007
hurricane season will again likely be above normal. The
development of La Niña, or really even a La Niña-like
pattern of tropical convection increases the probability for
a very active season and even more hurricane landfalls. Our
predicted ranges of activity reflect this high probability
of an above-normal season.
Now, given that we’re in a bit of a transition debating
ENSO-neutral or La Niña at this time, we’re going to
continue to monitor these evolving climate conditions, and
we’re scheduled to update the outlook in early August.
And now let me introduce Bill Proenza, Director of the
National Hurricane Center.
Mr. Proenza: Good morning, folks. As you’ve heard, NOAA,
with the National Weather Service, is predicting a very
active hurricane season. Your National Weather Service, its
National Hurricane Center, its weather forecast offices
across the country, the river forecast centers are all
ready. Your emergency management community, your local
government officials, they’re ready. With the media, the
emergency management community, we have a terrific
partnership to make sure that we not only keep the American
people aware, but also prepared.
As it stands at this time, we have growing challenges across
this nation, as far as the National Hurricane Warning
program is concerned. Looking at the population growth of
our nation to the vulnerable coasts, we now hear from the
U.S. Census that fully 53 percent of our population resides
within the first 50 miles of the coast. Couple that with the
infrequency that we’ve had over certain sections of the
coastline – for example, in the highly populous eastern
portion of our nation – and, of course, the fact that 2006
was an inactive year, relatively so, we are always concerned
that infrequency can be disarming.
So as the growing challenge is, look at the population that
we have to be effectively warning and effectively getting
out of harm’s way, we’re asking U.S. population in the
coastline areas to join us in what has been a very, very
effective partnership with emergency management, local
government officials, the media, to join us in preparing
yourselves, your families, your businesses, your
communities, to make sure that you have planned to do what
is right to assure the proper response when your area comes
under a hurricane warning, because only together, working
together, can we really make a difference. And we can make
sure that our nation, vulnerable as it is from tropical
storms and hurricanes, can be made to be resilient.
Thank you. With that, I want to introduce one of our
nation’s vital partners. In our National Hurricane Warning
program is the hurricane reconnaissance group of the U.S.
Air Force Reserve Command that’s led by General John
Bradley. The nation so appreciates General Bradley and his
20 crews that fly the Hurricane Hunters out of Keesler Air
Force Base near Biloxi, Mississippi.
General Bradley.
General Bradley: Thank you, Mr. Proenza. It’s a pleasure to
be here. I believe that what we do is a great example of
partnership in government between the Department of Defense,
the United States Air Force, and specifically the Air Force
Reserve Command, and the Department of Homeland Security,
National Weather Service, National Hurricane Center, and
NOAA, as well as FEMA.
So we’re very proud to be a part of this and to help, in
some small way, in preparing our nation for these terrible
storms.
Our 53rd Weather Reconnaissance Squadron at Keesler Air
Force Base in Mississippi has been doing this mission since
1946. I think the first storm that we flew into was – they
say it was a dare in a bar room that generated the first
flight in 1943 by the Army Air Corps into a hurricane.
That’s not the way we decide to test things anymore, but
it’s interesting that that’s the way it began. But we’ve
been doing this now for a very long time, and I’m very proud
that our airmen of the 53rd Reconnaissance Squadron do this
work for our nation.
We don’t just do these storm-tracking missions during the
hurricane season. We also fly winter storms as well. And
when they’re not doing that, these folks flying the C-130s
fly missions in support of our global war on terror. So
these folks deploy to other places that are very difficult
as well, but I don’t know that the flying there is any more
challenging that hurricane flying.
They fly these storms at about 10,000 feet. They initially
take a cut at this at a much lower altitude, but typically
the missions last 10 to 12 hours. They fly in and out and
fly a triangular pattern, taking different measures of
barometric pressure and other things. They drop a device
called a dropson to measure pressures and winds and so
forth.
This year and next year, we are adding a very nice new piece
of equipment to our aircraft that will help us more
accurately determine the surface winds at all times as the
storm is out over the water.
So we hope that the little bit that we do in flying through
these storms gives us a better predictor. They say maybe
it’s a 25 to 30 percent more accurate reading of the
intensity of the storm and where it might hit because of
flying through these storms.
I’m proud of these folks that do this. I hope you’ll take
the opportunity after this conference to go meet our crew
and see the airplanes, see the equipment that we use as we
try to tell the American people what we do to prepare our
nation for these storms.
Again, the Air Force Reserve Command and our Air Force is
very proud to be in this partnership, to help our nation
prepare for these what can be disastrous consequences. And
now as we transition into the preparedness, we are honored
to have the Secretary of the Department of Homeland Security
with us, as well as the Director of FEMA. So our next
speaker I’m proud to introduce is Secretary Michael Chertoff.
Secretary Chertoff: Thank you, General, for the
introduction, and thank you, everybody else, for your
comments.
I’m going to be very brief. I just want to make three
points. Whatever hurricane season may bring, we obviously
hope for the best but we prepare for the worst. And I think
that means three things. First of all, speaking for the
Department of Homeland Security, represented also here by
Administrator Dave Paulison of FEMA and by the Coast Guard,
which is represented by the helicopter, all of us have
worked very hard over the last year with state and local
government, who are the first responders, to carefully
review emergency planning and evacuation planning so that
everybody is prepared for this year’s hurricane season.
And it’s important to emphasize that although we typically
think of hurricanes as hitting the Gulf area or the area of
Florida and the Carolinas, it is quite possible to have a
hurricane further north in areas which are less accustomed
to dealing with hurricanes. And it’s been important to
emphasize to state and local officials there that they also
have to make sure that their emergency and evacuation plans
are dusted off and exercised.
Second, we are coming into this hurricane season with a set
of tools that we’ve never had before. We’ve got much more
communications equipment, including interoperable equipment
that is capable of being put on-site very quickly, including
real-time video to give us eyes on the actual situation when
the storm hits.
FEMA has worked very hard to get increased visibility into
the movement of goods and supplies as we move forward, to
see how we respond to a hurricane if it hits, and then we’ve
built a series of business processes and tools which will
enable us to enroll people if they’re suffering upheaval
because of the hurricane, will let us get assistance to them
more promptly, will guard more securely against the
possibility of fraud and abuse. And Administrator Paulison
will talk about these a little bit more when he comes up
here.
There’s one third and most important piece of the puzzle,
and that is individual preparedness. The fact is that no
matter how good your local responders are, your state
responders or your federal responders, they will not be
there instantly at the time a hurricane arrives.
It is the preparation of individuals, families and
businesses that makes the difference between survival and
disaster when a hurricane hits. That means preparing
yourself with the necessary tools, preparing yourself with
food and water to sustain you for up to 72 hours, having a
plan about what you do, and, most important, listening to
the guidance of your local officials about when to get out
in advance of a storm. A storm is no place to be a hero. And
the fact that somebody rides out a storm and puts themselves
in peril is not only an endangerment of their own lives, but
actually endangers the responders who have to get in there
and do the rescues.
So my view is, it’s kind of a civic responsibility for
everybody who’s in the zone of danger to take the steps
necessary and to listen to the instructions given so that we
can allow our responders to attend to those people who can’t
help themselves.
Finally, let me echo something that Bill Proenza said – and
I’m going to be as blunt as possible: Last year was an
unexpectedly easy season; there’s no guarantee that this
season is going to be anything less than very tough.
Complacency and disarming yourself are the biggest threats
that people face, in terms of getting themselves prepared.
It is a big mistake to count on being lucky. You’re much
better off preparing yourself for the worst, and then if you
get lucky, that’s a bonus.
So I think we’re all going to be up there urging that
message of fight complacency and be serious about this
before the hurricane season actually starts to hit in June.
I’m going to now introduce Dave Paulison, our Administrator
of FEMA, who has been at my side for the last couple of
years dealing with hurricanes and who brings a lot of
personal experience, going back to his days being fire chief
in Dade County to this hurricane challenge.
Dave.
Administrator Paulison: Thank you, Mr. Secretary. I think
this is like a congressional hearing. Everything that needs
to be said has been said, just everybody hasn’t said it yet.
But I do want to talk about a couple of things. One, we have
been working very hard, very closely with the Secretary to
make sure that the federal government is going to be ready –
not just FEMA, but the entire federal family – developing
those partnerships, putting those pre-scripted mission
assignments in place, putting contracts in place, working
with the states along the Gulf Coast, up the Atlantic Coast,
with Puerto Rice and the Virgin Islands, to do those gap
analyses to see where the issues are, where those gaps that
we can help them fill so we can tailor our response.
But what really keeps me awake at night, what really keeps
me awake at night, is something the Secretary touched on,
and that’s about personal preparedness. I spent this last
weekend, after I flew down to Florida Friday night, to start
getting my home ready – making sure my shutters worked,
opening and closing all of them, making sure my generator
ran, and making sure we have the things that we need to get
through hurricane season.
If we are going to survive these storms, if we’re going to
get into the recovery process much more smoothly that we
have in the past, it takes all of us to be ready. It takes
the federal government to be ready, and that’s our
responsibility to make sure that happens; the state
governments have to be ready; the local governments have to
be ready to respond. But so does the local community, the
local citizens have to be ready to respond and prepare
themselves for these storms – making sure they have a plan,
like you heard the Secretary say, about an evacuation. If
you’re in an evacuation zone, if you’re going to ride out a
storm, make sure you have your three-day supply of food,
water, flashlight, batteries, medicines, taken care of your
pets, making sure you have supplies for your children, all
of those types of things you’re going to have to survive for
the three or four days before help can truly arrive. That, I
think, is the most important thing.
If we all do our part, if all of us –the federal government,
the state and local community, and us as individuals – we
can’t stop the storm from coming, and we can’t necessarily
stop the damage, but we can also – together, we can get
through this and survive much, much better than we have in
the past.
So that’s my concern. My concern is the complacency that
we’ve seen in the past, the complacency we saw, quite
frankly, year before last with Hurricane Wilma in my
hometown of Florida, where we had tens of thousands of
people lined up for food and water and ice when they should
have been able to take care of themselves. We cannot
tolerate that anymore.
So I would ask emergency managers out there listening, the
media around in this room, that’s the message we have to get
across. We have predicted a very heavy hurricane season. We
need to make sure that those who are in those hurricane
zones have prepared themselves for this upcoming season.
And thank you very much. We can take a few questions now.
Mr. Franklin: Thank you, Director Paulison. When I recognize
you, we have time for just a few questions. Please state
your name and affiliation and to whom you’re addressing your
question. Yes, sir.
Question: A question for Secretary Chertoff. Hurricanes Rita
and Katrina in ‘05 took out 100 percent of Gulf Coast oil
production, 90 percent of gas production, and shut down,
what was it, seven refineries in the Gulf Coast region. Are
you assured by those various industries that they have – are
better able to survive a hurricane strike of that magnitude
now than they were then?
Secretary Chertoff: Well, the first thing is, of course,
there’s only so much you can do to resist a hurricane. I
know that the various companies involved have learned
lessons in taking steps based upon the experiences they had
in the Gulf storms of 2005 to build greater resiliency. But
I also want to be up front in recognizing that wind and
water can do an awful lot of damage, and nobody is
invulnerable to them.
One issue we have asked, we asked last year and we’re asking
again this year for all of the energy companies is to make
sure that their individual gas stations and their franchises
have generators available. One of the big lessons we learned
in 2005 is, if you don’t have generators to get the pumps
working, people can’t get to work, they can’t get food, they
can’t get water. Energy is the cornerstone of recovery and
resilience.
And so, as we did last year, we’re going to ask them to make
sure those generators are down there ready to go, both to
help people get the gas they need to evacuate, but also to
help get started up again after a storm.
Question: Thank you. This is for Secretary Chertoff. What
have you learned since your personal failure in your
response to Hurricane Katrina?
Secretary Chertoff: One thing I’ve learned is that some
reporters ask loaded questions. I’ll tell you what I’ve
learned. I’ve learned that the key to any successful
response is preparedness. No matter how good somebody is, if
you walk into an emergency, you’re not going to be able to
improvise a solution. That means the planning to deal with
issues has to begin years in advance. And one of the things
we’ve all learned from 2005 is how to do that planning.
That’s why we have the capabilities and the tools this year
that we didn’t have in 2005, and that’s why we have plans
with the Department of Defense this year that we didn’t have
in 2005, and frankly, that we didn’t have in the 1990s or
1980s either. And that’s why we’ve been working with state
and local authorities to make sure they’ve done their
planning properly because, again, the first responders have
traditionally been and will always be state and local
authorities. They’re the ones who know the people, they know
the landscape, they’re going to be close to the storm, and
therefore they have to get their plans in order and
synchronize with ours in order to be able to react properly.
So you’ve got the benefit this year of two years of
investment of substantial resources, an administrator of
FEMA who has real expertise, a great partnership with the
Department of Defense and the Department of Commerce, and a
lot of planning with state and local authorities, many of
whom I’ve spoken to personally and looked in the eye to make
sure that they have fully stepped to what they need to do.
Question: This is a question first for the Admiral, and then
for Mr. Proenza. Admiral, a report by NOAA recently came out
and said that seven years after the first operational use of
ocean surface vector winds, the nation – that means NOAA –
still doesn’t have a plan to operationally measure these
winds after the QuikSCAT satellite is gone. What have you
been doing for seven years? You’ve been there for five. Then
the other question for Mr. Proenza is, what does this lack
of data, if we were to lose QuikSCAT, mean for your
forecasters?
Admiral Lautenbacher: There has been a plan, and the plan
has been in place for a long time. We have two experimental
satellites. One is QuikSCAT, and one is the Coriolis
WindSat, which was launched not that long ago and will last
longer than the scatterometer.
We have been learning, in the last couple of years, to use
vector windfield data in our models, and it’s proven to be
very important. Our original plan was to use the conical
microwave imaging scanner to provide the vector windfield
data. We are relooking at that, based on the recommendations
of Mr. Proenza at this point, and I’ve asked my team to go
back and review it again, along with our satellite experts,
to see what would be practical, in terms of providing for
continuity of scatterometry data versus switching to the
Conical Microwave Imaging Sounder. So that’s the situation
we have at this point. Thank you.
Mr. Proenza: The satellite known as QuikSCAT provides us
operationally and has been used operationally since 2000,
especially for our hurricane program. As it stands, it is a
broad swath of data that comes across to us, that shows the
envelope in which a storm may be existing; that indicates to
us not only wind speed, but also wind direction. It gives us
an estimate of the size of the tropical storm winds and the
hurricane winds. It’s a vital piece of data to us in our
operational National Hurricane Warning program, as it is for
the high seas forecasting for not only the nation, but it is
a service that’s used over 90 percent of the global oceans.
We have had several discussions along the lines of how we
can increase the priority for a QuikSCAT replacement. I am
encouraged in those conversations that we have had, and
discussions we have had, that the nation will be moving
ahead very constructively in coming up with a design
next-generation QuikSCAT to replace the current, which is
still operational QuikSCAT that we have at this time.
Question: With another active hurricane season – this is for
Mr. Paulison or Mr. Chertoff – some governors are, I’m sure,
going to express their concerns again that there may not be
enough National Guardsmen at home to take care of it. Is
this a concern for NOAA – for FEMA or the Department of
Homeland Security? And also, what are the numbers – what are
the numbers of Guardsmen who are going to be here and
available this year, as opposed to 2005 and 2004, the other
active hurricane seasons?
Administrator Paulison: It’s an issue we’ve talked about
quite a while with the adjunct generals – when I was in
Kansas, visiting there with the adjunct general, making
comments about how he was at 50 percent of his authorized
force strength. But 50 percent is a wartime strength issue,
and the fact that the equipment that he had on the ground
for responding to natural disasters was significant. But I
also told him how we respond in this country, using what we
call the Emergency Management Assistance Compact system,
where we bring in not only National Guard, but resources
from all the other states – all 50 states in this country
are part of that system, where we share resources with one
state to another.
If one state has a disaster or some type of catastrophe it
has to deal with, it puts out through this EMAC system the
equipment that it needs, and then it starts flowing from the
other states. During Hurricane Katrina, we actually had
National Guards from all 50 states into that state to help
them out with those disasters. On top of that, we can bring
the Army Corps of Engineers in – it has heavy equipment. We
have contracts in place already to bring those types of
equipment in. So I’m very comfortable that regardless of
what happens, particularly a hurricane, we can flow
equipment and supplies and staffing into a particular state
to cover those areas.
Question: (Inaudible.)
Administrator Paulison: I couldn’t answer that. I can tell
you, my own home state of Florida, Craig Fugate announced –
said at the hurricane conference that he has more people
available to him this year than he had in the past. That’s
the only state that I’m aware of.
Question: A question for Admiral Lautenbacher. Admiral, sir,
last week your Hurricane Center Director, Mr. Proenza,
criticized NOAA for spending millions on public relations,
he said at the expense of technologies that he needed, and
that it also devalued brands the public trusts, like the
National Hurricane Center and the National Weather Service.
By virtue of having this event here this year in Washington,
rather than in a hurricane-prone area like Miami in the
past, is this evidence of that? And would you respond to
that criticism?
Admiral Lautenbacher: Clearly not evidence of that. This is
– we move the hurricane conference around year to year in
various places. We believe that it’s important to bring it
to Washington, to the attention of people in Washington who
have to deal with these issues. So this is part of trying to
improve our outreach.
Now, in terms of the money being spent, you have to remember
Mr. Proenza just took over as the head of the Hurricane
Center, and he is known for being a very strong and forceful
advocate for his programs. And that’s one reason why we love
him. So we are continuing to work with Bill, who did not
have a chance to build his budget for what he’s working on
today. And I’ve asked the Weather Service to ensure that he
has what he needs to provide everything that we need to do
what’s responsible during this hurricane season.
Now, in terms of the outreach program that we have, in my
view – and we may have a little disagreement here – I view
we spend pathetically little on our outreach program. No
matter what size your organization is, whether it’s huge or
small, if you’re not spending some money on trying to
connect with the public, on trying to explain why it’s
important to pay attention to the information that we have,
a perfect forecast provides no information at all.
So we have a program each year where we have outreach items,
and we look at ways to reach the public. This year’s was
based on the fact that the first part of NOAA began in 1807,
providing benefit for the economy and saving lives for the
American public 200 years ago, and that’s been built up over
those years. We’re not spending any more money than we
normally spend for these outreach-type items. And again, I
defend that as an essential part of our organization, to
provide warnings to the public. Thank you.
Question: This is a question for Gerry Bell. What causes
these sudden waxing and waning of the El Niño? And you often
hear about dust in the Sahara coming over and having an
effect on hurricanes. Could you talk a little bit about
those things?
Dr. Bell: Regarding El Niño and La Niña, we call it the El
Niño-La Niña cycle. This is a naturally occurring climate
phenomenon linked to changes in tropical Pacific Ocean
temperatures. El Niño refers to the situation when the
waters are warmer than normal, and La Niña refers to the
situation when the waters are cooler than normal. It’s a
naturally occurring climate cycle that can strongly affect
not only hurricanes, but as we know, our winter weather
patterns and jet streams and storm tracks, and so on.
They really vary quite a bit in how they develop. Sometimes,
as we saw last year, El Niño can develop very quickly. Other
times an El Niño or La Niña similarly will develop over
many, many months, and our computer models will be able to
handle that better. So what we’re understanding now is there
are several – apparently several different mechanisms by
which one of these events can form. And we’re still trying
to understand what those are to then get them in our ENSO
prediction models so that we can better predict the onset,
and also the decay, of these systems.
The second question was regarding African dust. That’s a
very important issue, and NOAA is heavily involved in that.
Last year, with the AMAC project – it was an African
Meteorology and Climate project – we had several – we were
heavily involved in looking at things like African dust.
Its impact on last year is still a bit uncertain. I don’t
think we have a really good handle on that. It looks like El
Niño, and also just mid-latitude weather patterns that help
to redirect the hurricanes way out to sea, were the main
factors for the reduced activity and the lack of hurricane
landfalls last year.
Question: Does the dust promote hurricane development or –
Dr. Bell: It’s not entirely clear what the role of the dust
is, and I’m definitely not an expert in this area. Some
people argue that it affects the radiation balances and can,
therefore, affect the atmospheric stability. Other people
argue, say, well, the dust is really simply a manifestation
of extremely dry air coming off the Sahara. But we see
African dust outbreaks a lot and it’s not clear if it
actually affects the seasonal activity, or not.
There are other major climate factors that we use in the
forecast that really account for much of the year-to-year
and decade-to-decade variability that we see. But it’s an
important issue and a lot of work is being done, and will
continue to be done on the dust issue.
Mr. Franklin: Thank you very much. That’s all we have time
for today.
Arctic Change--The objective of this NOAA website is to present recent indicators that describe the present state of the Arctic climate and ecosystem in an accessible, understandable, and credible historical context. http://www.arctic.noaa.gov/detect/
--EuroTempest provides real-time forecasts out to 5 days ahead for European windstorms and their localised potential wind damage. The interactive web-based service http://www.eurotempest.com offers local damage forecasts, down to postcode level, for winter storms affecting seven European countries (United Kingdom, Belgium, Denmark, France, Germany, Ireland, and the Netherlands). The new service also includes warnings for the severity and timing of high windspeeds in all other European countries.
Climate Institute--The Climate Institute has been in a unique position to inform key decision-makers, heighten international awareness of climate change, and identify practical ways of achieving significant emissions reductions. This has been done through several different media including symposia, conferences, roundtables, and special briefings. http://www.climate.org/climate_main.shtml
Climate Variability and Predictability [CLIVAR]--To describe and understand the physical processes responsible for climate variability and predictability on seasonal, interannual, decadal, and centennial time-scales, through the collection and analysis of observations and the development and application of models of the coupled climate system, in cooperation with other relevant climate-research and observing programmes. To extend the record of climate variability over the time-scales of interest through the assembly of quality-controlled paleoclimatic and instrumental data sets. To extend the range and accuracy of seasonal to interannual climate prediction through the development of global coupled predictive models. http://www.clivar.org/
Global Drought Monitor--The Global Drought Monitor is a free internet application which monitors the severity of drought worldwide on an ongoing basis. The product will aid humanitarian relief by assisting warnings of potential food, water and health problems. The Global Drought Monitor will also benefit the general public, government and industry by improving awareness of droughts and their impacts. Global Drought Monitor
Global Warming: early Warning Signs--Global temperature in 1998 was the hottest in the historical record, and the temperature increase over the 20th century is likely to be the highest of the past millennium. Global average temperatures have warmed about one degree Fahrenheit (0.6�C) since 1900. The ten warmest years on record have occurred since 1987, seven of them since 1994. This map illustrates the local consequences of global warming. http://www.climatehotmap.org/
Intergovernmental Panel on Climate Change--The Intergovernmental Panel on Climate Change (IPCC) has been established by WMO and UNEP to assess scientific, technical and socio- economic information relevant for the understanding of climate change, its potential impacts and options for adaptation and mitigation. http://www.ipcc.ch/
International Research Institute for Climate and Society--The mission of the IRI is to enhance society's capability to understand, anticipate and manage the impacts of seasonal climate fluctuations, in order to improve human welfare and the environment, especially in developing countries. This mission is to be conducted through strategic and applied research, education and capacity building, and provision of forecast and information products, with an emphasis on practical and verifiable utility and partnerships. http://iri.ldeo.columbia.edu/
Linking Climate Adaptation Network--The objective of the Linking Climate Adaptation (LCA) Network is to help communities, policy-makers, practitioners and academics share experiences and knowledge about adaptation to climate change. Funded by the Department for International Development and implemented by the Institute of Development Studies , the LCA Network is a web-based discussion forum with over 600 members from across the globe. The Network also aims to facilitate action research for climate change adaptation by vulnerable communities and host moderated online discussions on key adaptation topics.
http://www.linkingclimateadaptation.org/
National Climatic Data Centre--NCDC is the world's largest active archive of weather data. NCDC produces numerous climate publications and responds to data requests from all over the world. NCDC operates the World Data Center for Meteorology which is co-located at NCDC in Asheville, North Carolina, and the World Data Center for Paleoclimatology which is located in Boulder, Colorado. NCDC supports a three tier national climate services support program - the partners include: NCDC, Regional Climate Centers, and State Climatologists. National Climatic Data Centre
National Environmental Satellite, Data, and Information Service--NESDIS provides timely access to global environmental data from satellites and other sources to promote, protect, & enhance the Nation's economy, security, environment, & quality of life. National Environmental Satellite, Data, and Information Service
National Lightning Safety Institute--(NLSI) is a non-profit, non-product advocacy of lightning safety for both people and structures: * Personal Lightning Safety means anticipating a high-risk situation and moving to a low-risk location. * Structural Lightning Safety means using various exterior and interior defensive systems in a detailed, site-specific process. http://www.lightningsafety.com/
NOAA Storm Prediction Centre--The Storm Prediction Center (SPC) is part of the National Weather Service (NWS) and the National Centers for Environmental Prediction (NCEP). Our mission is to provide timely and accurate forecasts and watches for severe thunderstorms and tornadoes over the contiguous United States. The SPC also monitors heavy rain, heavy snow, and fire weather events across the U.S. and issues specific products for those hazards. We use the most advanced technology and scientific methods available to achieve this goal. NOAA Storm Prediction Centre
NOAA-CIRES Climate Diagnostics Centre--What are Climate Diagnostics, anyway? Most people hear the word "diagnosis" only when they go to the doctor. After taking your medical history, performing a physical examination and perhaps ordering some "diagnostic" lab tests, the doctor pronounces "You have the flu," or some other diagnosis. What we do at the Climate Diagnostics Center is similar in many ways, only our "patient" is the Earth. Instead of taking the body temperature we analyze the air and water temperature. Instead of the blood pressure, we look at measurements of atmospheric pressure. We don't look for diseases, but rather we identify naturally recurring atmospheric and oceanic features such as El Niño. While medicine is based mostly on the biological sciences, we use the laws of physics and chemistry to study weather and climate. Climate diagnostics -- studies of the interrelationships among climate variables -- are what we use to make sense of the myriad observations of the atmosphere and oceans. NOAA-CIRES Climate Diagnostics Centre
Science Policy Assessment and Research on Climate--Each day, in the face of deep uncertainty, millions of decisions are made that respond to and influence the behavior of climate. How does the nation’s multi-billion dollar investment in climate research affect those decisions? How can the societal value of this scientific investment be enhanced? These are the core organizing questions for Science Policy Assessment and Research on Climate (SPARC) which conducts research and assessments, outreach, and education aimed at helping climate science policies better support climate-related decision making in the face of fundamental and often irreducible uncertainties. SPARC is a joint project of the University of Colorado's Center for Science and Policy Technology Research and the Arizona State University's Consortium for Science, Policy, & Outcomes, sponsored by National Science Foundation (NSF). http://sciencepolicy.colorado.edu/sparc/
Tropical Storm Risk--The Tropical Storm Risk (TSR) venture developed from the UK government-supported TSUNAMI initiative project on seasonal tropical cyclone prediction which ran from October 1998 to June 2000. The TSR consortium comprises experts on insurance, risk management and seasonal climate forecasting. The TSR industry expertise is drawn from Benfield, the leading independent reinsurance intermediary, Royal & SunAlliance, the global insurance group, and from Crawford & Company, a global claims management solutions company. The TSR scientific grouping brings together climate physicists, meteorologists and statisticians from the UCL (University College London) Benfield Hazard Research Centre and the Met Office. http://forecast.mssl.ucl.ac.uk/shadow/tracker/dynamic/main.html
U.S. Global Change Research Program [USGCRP]-- The U.S. Global Change Research Program (USGCRP) supports research on the interactions of natural and human-induced changes in the global environment and their implications for society. Participants in the USGCRP include: Agency for International Development; Dept. of Agriculture; Dept. of Commerce, Natl. Oceanic & Atmospheric Admin.; Dept. of Defense; Dept. of Energy; Dept. of Health and Human Services, National Institutes of Health; Dept. of State; Dept. of Transportation; Dept. of the Interior, US Geological Survey; Environmental Protection Agency; National Aeronautics & Space Administration; National Science Foundation; Smithsonian Institution. http://www.usgcrp.gov/usgcrp/default.htm
The contents of this site, unless otherwise specified, are copyrighted by © Big Medicine 2001-2007. The news provided is for personal use only. Reproduction or redistribution of the this site, in whole, part or in any form, requires the express permission of Big Medicine or the original source. For questions or comments pertaining to this site, contact the web administrator. Big Medicine is not responsible for the content of external sites linked and does not endorse their content. Advertisers are not responsible for Big Medicine contents, the content of external sites linked and do not endorse their content.